
Welcome to Nightpixels, a visual blog about investing, business, and technology.
Nightpixels is published each week by Nightview Capital Research Analyst Cameron Tierney. Follow him here on X and Linkedin.
Sign up to receive weekly Nightview Capital updates below.
Error: Contact form not found.
The Pareto principle in stock returns
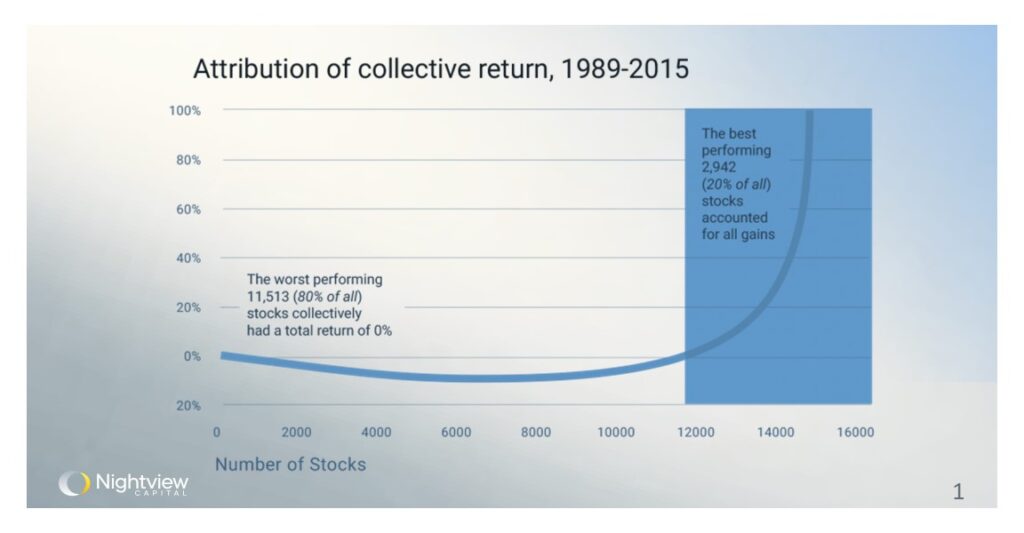
This chart illustrates the distribution of collective stock returns from 1989 to 2015. Notably, it shows that the top-performing 2,942 stocks (20% of all stocks) accounted for all the gains in the market. In contrast, the worst-performing 11,513 stocks (80% of all) collectively had a total return of 0%. This data is exemplary of the Pareto principle, where a small percentage of (in this case) stocks drive outsize performance. This insight is crucial for investors focusing on stock selection and portfolio diversification, underscoring the importance of identifying and investing in best ideas to have a chance at outperformance.
Source
The S&P 500 has never been more top-heavy
This chart tracks the top 10 stocks by market capitalization as a percentage of the top 500 companies by market cap from the 1880s to the present. As has been well-covered by financial media, the S&P 500 is unprecedentedly concentrated. Today, the top 10 stocks account for over 30% of the entire index’s market cap. Although this chart is technically not representative of the index itself—the modern S&P 500 index was established in 1952—it illustrates that the only other time since the 1880s that concentration reached these levels was in the 1950s and 60s. At that time, AT&T dominated the S&P 500. The recent surge highlights the dominance of a few mega-cap companies in today’s market, raising concerns about the sustainability of such concentration and whether indexing is a prudent strategy for investors interested in diversification.
Source
Options volume has never been higher
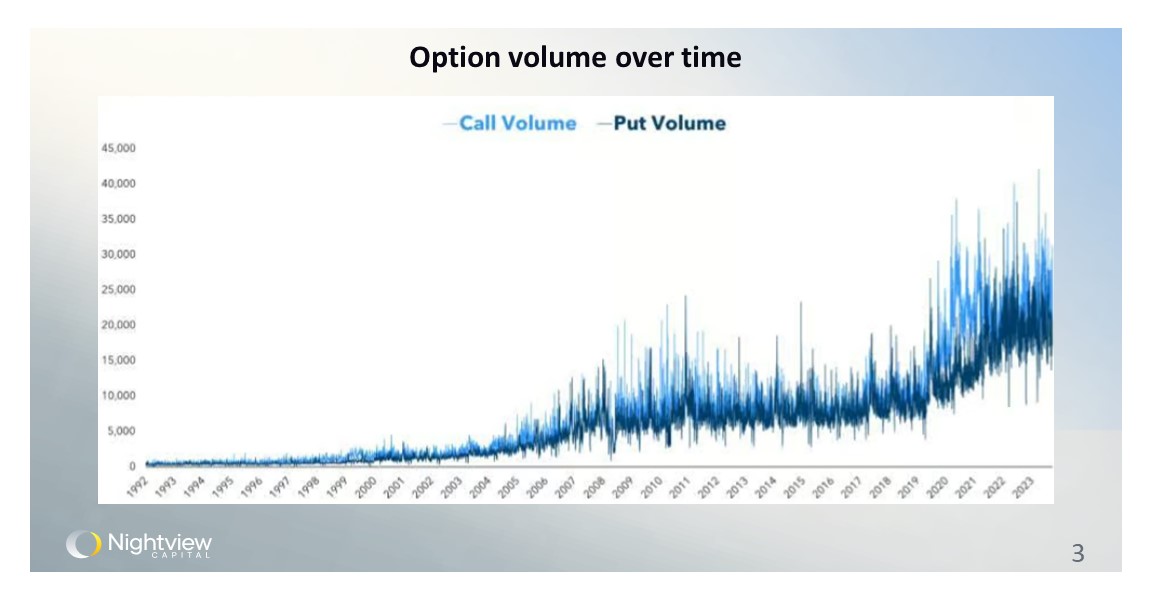
The chart shows the volume of call and put options traded from 1992 to 2023. Over time, both call and put volumes have trended up, exploding in volumes around 2020. This boom reflects growing investor interest in and access to options trading. It has never been easier for retail investors to access these products and place trades, especially considering low and no fee brokerages that are now industry standard. Options contracts are derivatives of underlying securities. Their proliferation among investors forces market makers and other participants to change their buying and selling behaviors at the margin, altering the texture of global financial markets.
Source
Equity risk premiums are approaching Dotcom bubble levels
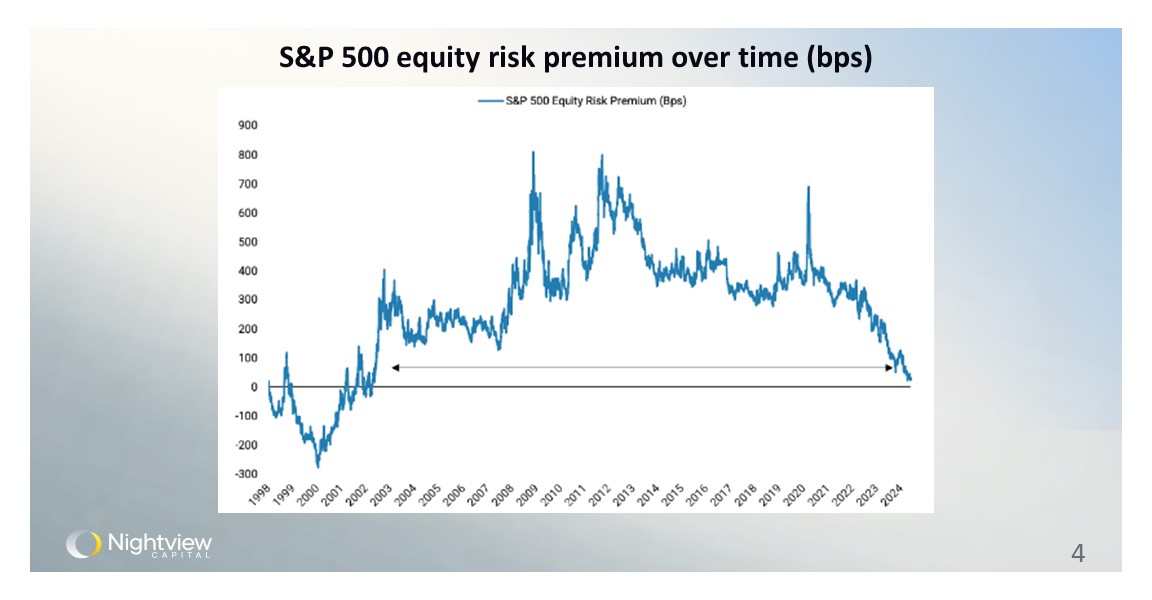
This chart presents the S&P 500 equity risk premium, calculated as the forward 12-month earnings yield minus the nominal 10-year Treasury yield. Current levels are approaching the equity risk premium of the Dotcom era, where investors were not well-rewarded for taking on incremental equity risk in their portfolios. In general, lower equity risk means investors should be more wary of buying stocks because future returns are expected to be lower than recent history. For passive strategies, this can spell doom, but salient active managers may be able to navigate the storm and outperform.
Source
The U.S. and Canadian economies are going their own ways
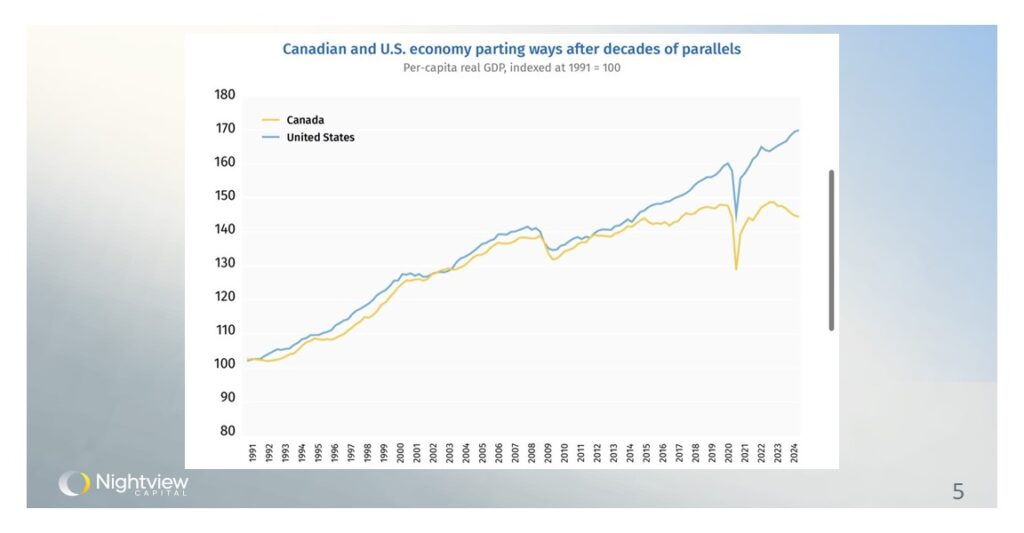
This chart compares the per-capita real GDP of Canada and the United States from 1991 to 2024, indexed to 1991 levels. Both economies showed parallel growth trends until the late 2010s, after which they began to diverge. The U.S. economy has experienced a sharper recovery and higher growth rate post-2020, while Canada’s growth has been more subdued, even slipping into decline. After decades of coupled movements in per-capita GDP, it seems the U.S. has pulled away from Canada and continued its growth, at least for now.
Source