
Welcome to Nightpixels, a data-driven visual blog about investing, business, and technology.
Nightpixels is published each week by Nightview Capital Research Analyst Cameron Tierney. Follow him here on X.
Sign up below to receive The Nightcrawler newsletter.
Error: Contact form not found.
Churn is concentrated in video streaming—not audio
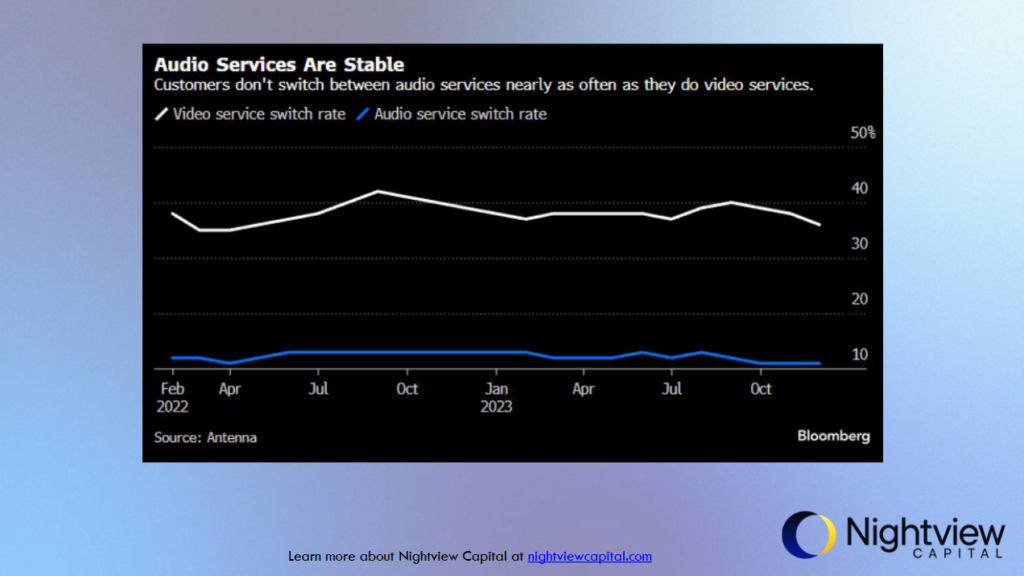
This chart compares the switch rates between audio and video streaming services from February 2022 to October 2023. It shows that customers are much less likely to switch audio services compared to video services, with the switch rate for audio remaining below 10% and relatively stable, while the video switch rate fluctuates around 30-40%. This stability in audio service usage speaks to the consumer choice to listen to all their music on one platform, vs. a more fickle video streaming customer base. Audio streaming services exhibit a more loyal customer base and potentially more predictable revenue streams compared to their video counterparts.
Source
Gas prices have retreated from recent-year highs
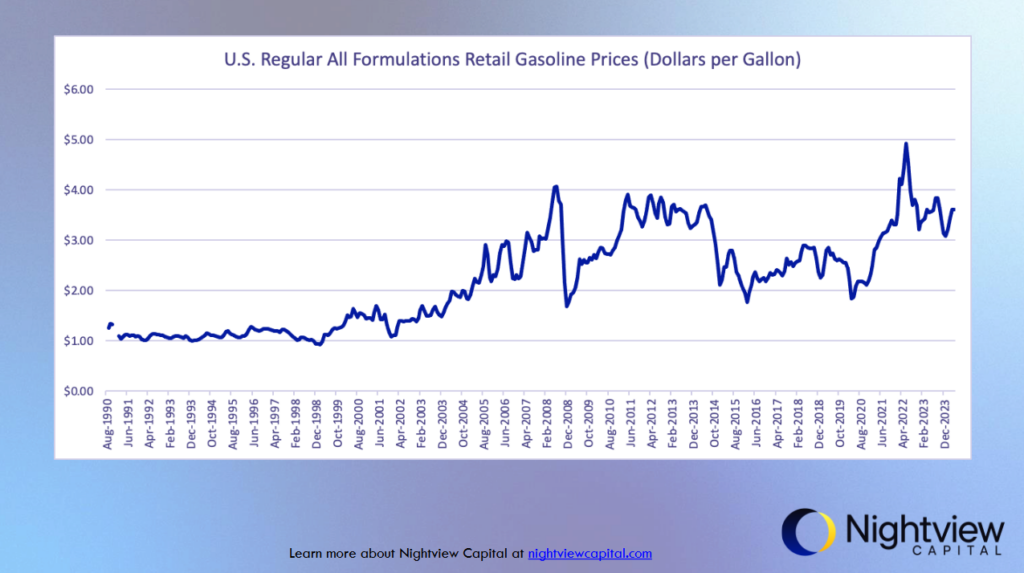
This chart tracks the national average gas prices in the U.S. from the early 1990s until 2024. As oil prices have retreated—and economic data has softened—gas prices have moved commensurately. Often lauded as a bellwether for the consumer and economy more broadly, stabilizing gas prices could be a sign of a slightly cooling economy.
Source
Tesla is still the only automaker mass producing EVs for the U.S. market
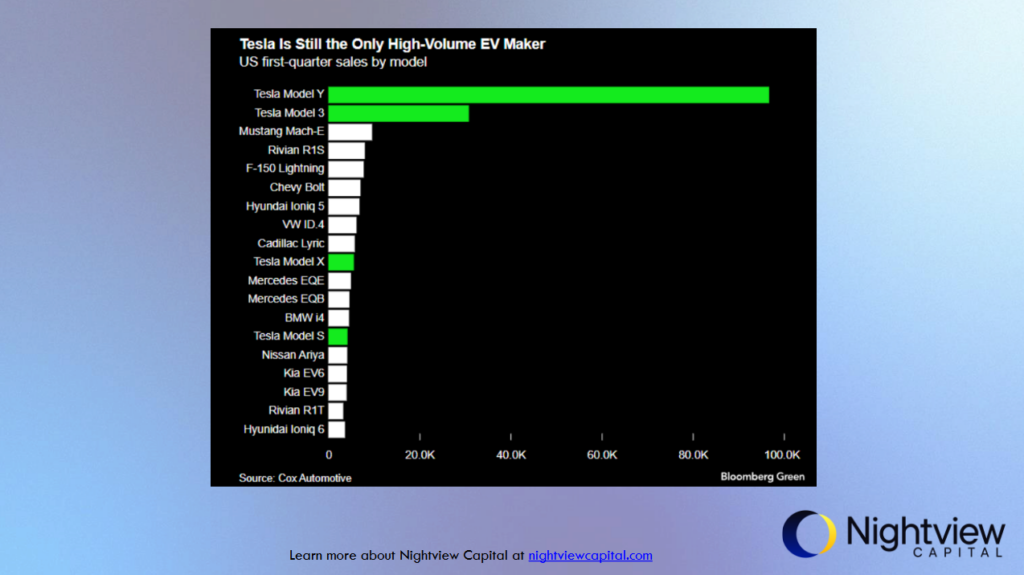
This bar chart shows the sales figures for various electric vehicle models in the U.S. during the first quarter of 2024. Tesla models dominate the chart, with the Model Y and Model 3 leading by a significant margin. Other models like the Mustang Mach-E and Rivian R1S show moderate sales, while the rest, including offerings from traditional automakers like BMW and Hyundai, lag behind.
Source
Nvidia’s segment revenue shows data center is driving growth

This chart illustrates NVIDIA’s revenue growth by segment from FY2021 to FY2024. The data center segment has seen a remarkable increase, growing 20 times from $1.1 billion in FY2021 to $22.6 billion in FY2024, now making up 87% of the company’s total revenue. Other segments, including gaming, professional visualization, automotive, and OEM & other, show consistent, but smaller, growth. This information underscores NVIDIA’s strategic focus and successful expansion in the data center market, largely driven by demand for its high-end AI processors like the H100. By some estimates, Nvidia owns over 90% of the AI data center market today.
Source
FDIC-insured banks’ unrealized losses are at a two-decade high
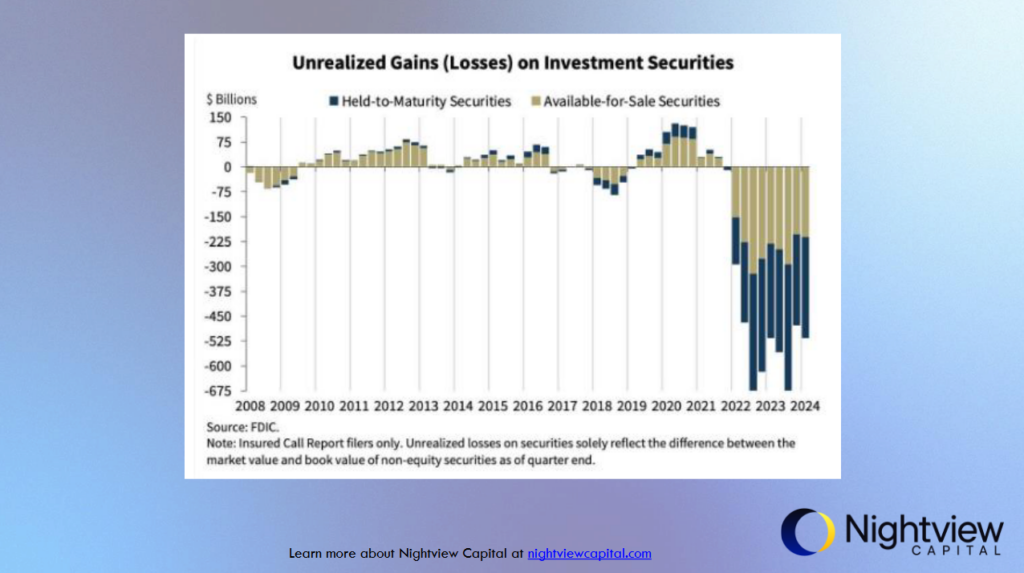
This chart depicts the unrealized gains and losses on investment securities held by insured call report filers from 2008 to 2024. The chart shows that during the 2008 financial crisis, institutions faced significant unrealized losses, which gradually turned into gains as the market recovered. From 2011 to 2019, both categories mostly remained in positive territory, indicating stable gains. However, from 2020 onwards, the trend reversed sharply, with substantial unrealized losses particularly evident from 2022 through 2024. These recent losses are likely influenced by rising interest rates and market volatility. The sharp decline in recent years suggests increased risk and potential challenges for financial institutions in managing their investment portfolios.
Source
 Previous