
For most recent Fund Holdings and Fund Performance, please visit the Fund website.
Sign up below to receive Nightview Capital research and updates.
Error: Contact form not found.
Dear Shareholders,
More than a decade ago, we took our first position in Amazon (AMZN).
One of the traits we most admired about the company was management’s obsession with improving the customer value proposition—even if that meant reducing margins and the company’s bottom line. The underlying bet that Jeff Bezos was making—across both the retail and cloud operations of the business—was as much about scale as it was about human behavior.
“If you build a great experience, customers tell each other about that,” Jeff Bezos once said. “Word of mouth is very powerful.”
We agree. And we also believe the same philosophy should apply in our own industry of investing and money management. As you may know, we recently transitioned the Long Only fund to an Exchange Trade Fund (ETF). As of June 21, 2024, The Nightview Fund (“NITE”) ETF trades on the New York Stock Exchange under the ticker NITE.
NITE employs a strategy that deals principally in common equities. As an ETF, NITE provides daily liquidity to investors and full transparency. There’s also no minimum investment requirements (which makes it accessible for retail investors) and there’s no limitation on redemptions. In a nutshell, we are proud to offer an ETF structure for investors of all types.
But perhaps the most compelling element of the ETF structure are its tax benefits: unlike mutual funds or private funds, ETFs rarely distribute capital gains to its investors. ETFs utilize an in-kind creation and redemption process that helps ETFs to offload low-cost-basis securities through in-kind redemptions, which avoids triggering capital gains taxes for its investors. In other words, it’s possible that ETF investors could only pay capital gains when selling their position in the ETF.
In our view, this makes the structure well-suited for long-term investors who seek to compound their wealth uninterrupted for many years. In a sense, investing in an ETF is like investing in a stock—the investor typically only pays significant gains if they liquidate their position. For mutual funds and private funds, on the other hand, investors will pay capital gains each time the portfolio managers realize gains with the portfolio.
A little over a year ago, our team began learning about all the benefits of the ETF structure, and we began to realize that this was most likely a better vehicle for our investors. As a firm, we strive to mimic the Amazon model wherever possible and make customer-centric decisions. So we pursued this model, and a year later, we debuted on The New York Stock Exchange. It was an exciting milestone for our firm.
With the ETF structure, we believe that NITE is an attractive option for a broad range of investors, including individuals, family offices, Registered Investment Advisors (RIAs), and professional investment managers. NITE is designed for long-term investors who seek a concentrated, actively managed equity growth strategy. We believe our commitment to deep, meaningful research and a disciplined investment process sets us apart. Of course, there are always risks ahead, and investors should think carefully about their positioning. But as a firm, we’re quite bullish about the future.
In the following letter, we’ll offer a top conviction idea: Amazon. It’s a fitting research deep-dive for this quarter, in particular.
Following our discussion of Amazon, we’ll review holdings in the current portfolio as of the end of Q2 2024.
If you are interested in learning more about Nightview Capital, please visit our website: www.nightviewcapital.com.
Amazon: Quarterly Review
In this quarterly overview, we will look at Amazon’s core business lines and where we see potential for outperformance. Our analysis focuses mainly on areas where we believe the market, while generally positive towards Amazon recently, could be underestimating both top line growth—and meaningful margin expansion.
Like many companies during the pandemic, Amazon faced immense challenges in near-term forecasting. These challenges led to a significant dislocation in company resources and capital allocation. However, coming off a period of overexpansion, we have tracked significant adjustments in the last 24 months that we believe have re-aligned company resources to better reflect the go-forward market opportunity.
In a nutshell, we believe AMZN is stronger than ever, and that there could be a multi-year diversified business opportunity ahead of us. We remain highly positive on the business—and optimistic about both the company and equity over the next 12-24 months. As of July 1, 2024, AMZN remains one of our top 5 holdings, at a weighting of 13.03%.
Advertising
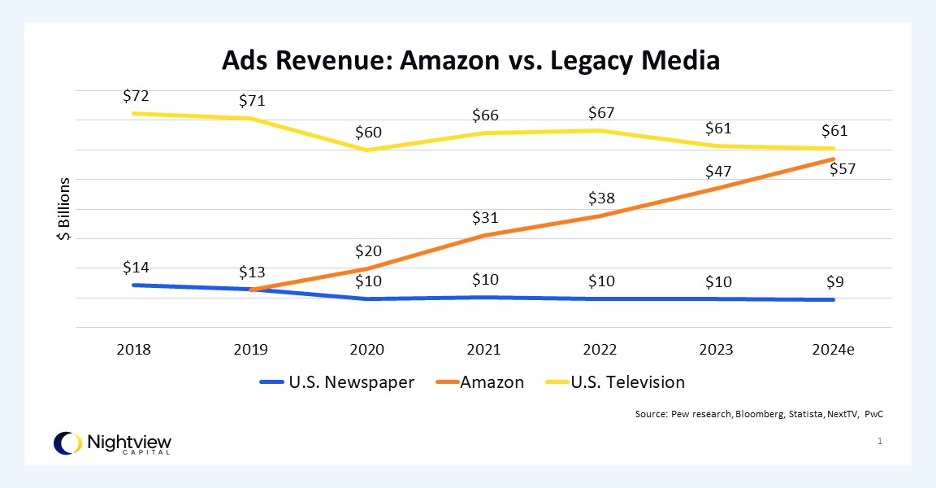
Born from its e-commerce platform, Amazon Advertising (“Amazon Ads”)—now at an estimated $55 billion annualized run-rate—is one of the largest advertising businesses in the world. For context, the newspaper industry currently drives about $10 billion in advertising revenue, meaning Amazon ads is now roughly 5.5x larger than the entire newspaper industry.[1]
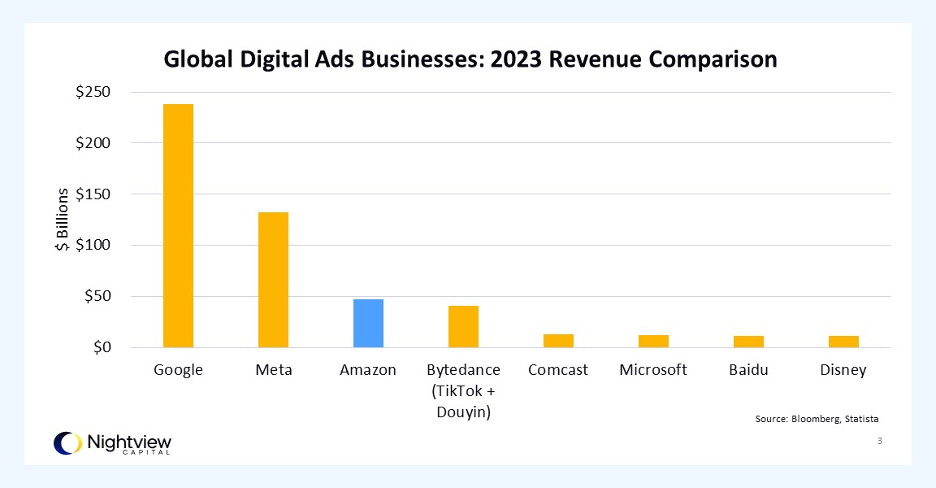
There is good reason for Amazon Ads growth: it combines high fidelity first-party data (i.e. customer intent) and significant ad inventory (i.e. thousands of Amazon sellers). This dynamic presents opportunity in the advertising world. While there has been increased recognition, we believe the market is still underestimating the potential of this business, especially relative to advertising platforms at Meta and Google.
The evolution of the Amazon advertising business has been a long and measured one. The first “Amazon Product Ads” was launched in 2006, which allowed promotion for third party sellers on the platform. This evolved over time into sponsored products, launched in 2013, where advertisers could bid on keywords to prominently feature their products. In 2015, ad buyers saw the beginning of Amazon Marketing services which featured a suite of tools for brands to manage their advertising campaigns holistically.
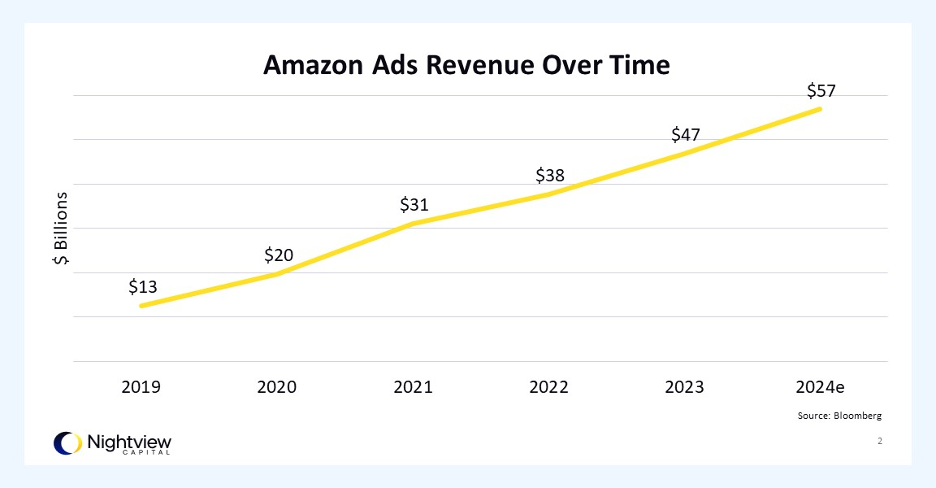
This bedrock coalesced into the “Amazon Advertising” unit where all initiatives were centralized under a single brand in 2017. Up until this point, growth in this unit had been steady, but it was a relatively small component of the overall Amazon business. However, since 2018, revenue has grown from $9.2 billion to the current $55 billion run-rate this year, now representing about 10% of Amazon’s total expected revenue in 2024.
One of the difficulties facing mega-cap tech is capital allocation into new projects. Victims of their own success, new capital projects must not only achieve a positive net present value (NPV) but alsobe meaningfully large enough to materially impact overall revenue. Amazon has now successfully incubated two massive ventures with Amazon Web Services and Amazon Advertising. This is no small feat considering Amazon’s total revenue was $574 billion last year.
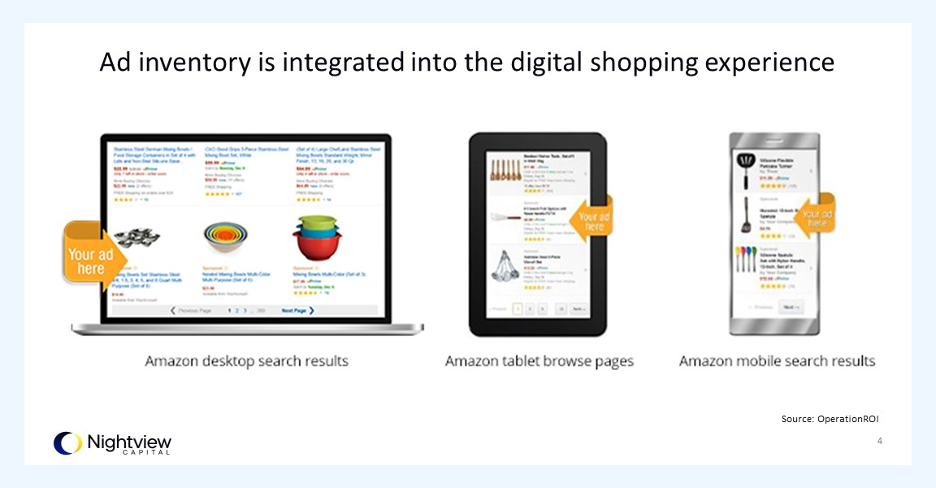
We still see plenty of room to grow and have been impressed with the diversity of offerings Amazon has incorporated into their ads business. On Amazon, customers are already going to the site to browse for products and engage in purchasing decisions. Customer intent data, in our view, is a valuable component to the Amazon ads platform.
Additionally, Amazon Ads’ audience characteristics are unique relative to other digital advertising platforms. Amazon collects purchasing and browsing data on its hundreds of millions of signed-in users. The velocity and volume of purchases on Amazon is also unique – small and medium size businesses sold 8,600 products per minute in 2023, for example, per Amazon.
The platform works in many ways because of how close it is to end customers. “Amazon in many ways is building the killer app,” John Terrana, chief media officer at the ad firm VaynerMedia, told the WSJ recently.[2] It has “premium content, live sports, immense scale,” and advertisers can target ads to their customers and can often see if a viewer bought the product on the platform.”
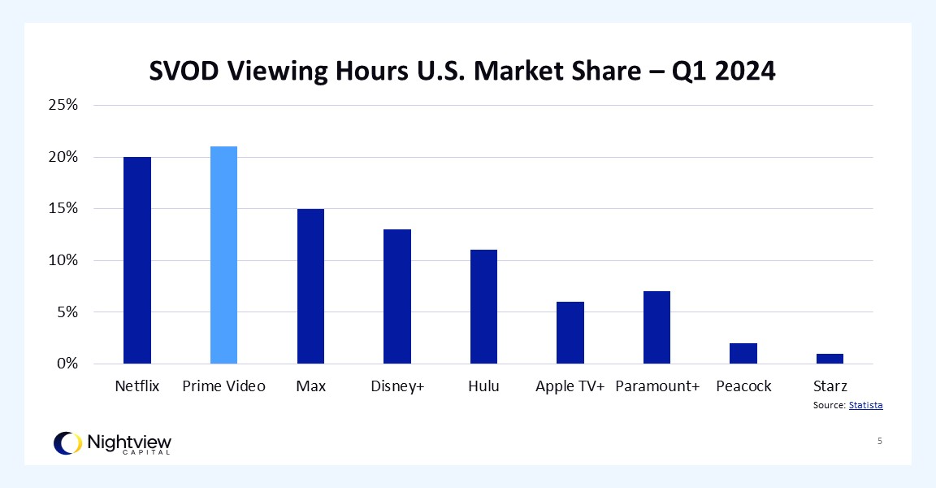
Amazon Prime Video has only just begun integrating video ads into its model. Of Prime Video’s roughly 200 million monthly active users (MAUs), currently 85% are on the ad-supported tier[3]. By some measures, Prime Video is already the most popular streaming video-on-demand (SVOD) service by viewing hours. The integration of ads into the model provides Amazon ads with new, differentiated inventory relative to its display and sponsored products ads.
“In terms of additional things, we’re excited about, I think that we have barely scraped the surface with respect to figuring out how to intelligently integrate advertising into video, into audio, and into grocery, so I think we’re early days in that”, Andy Jassy Q3 2023 AMZN earnings call.
Ads is also high margin, especially compared to the retail business, and while Amazon doesn’t break out gross margins for the unit, our analysis places gross margins conservatively around 80%. At this year’s revenue run rate, that would equate to around $44 billion of gross profit. This is roughly the same amount of gross profit the entirety of Amazon made in 2016[4].
Additionally, assuming a conservative 40% operating margin for the segment, this would place advertising operating income at $22 billion for 2024 which is roughly 2/3 the earnings before interest (EBIT) of AMZN as a whole last year. We don’t believe this is fully understood by the market.
We think the trend of many businesses in the 2020s will be native advertising (see: Costco’s recent launch) and that in many ways this is an underappreciated growth trend. Amazon’s unique reach, scale and ambition make it our favorite play in this space— and we agree with Andy Jassy that it’s possible we are only scraping the surface.
Logistics As A Service
Amazon’s capital expenditures (“capex”) moat, which has now been built up over decades, is another asset that we believe is underappreciated by the broader market. What Amazon did was prescient: they funneled AWS operating profits into building out their logistics operations throughout the 2010s. Creating another advantage in e-commerce distribution.
low margins + high capex + large time to build out = moat
Similar to the advertising business, the “logistics as a service business,” or rather businesses, has been incubating for more than twenty years (SEE: Toys R Us Joins With Amazon – Aug 18, 2000).
Fulfillment by Amazon (“FBA”), which allowed third-party sellers to store their products in Amazon fulfillment centers, was launched in 2006. This unit enabled small sellers to tap into the Amazon logistics network, which resulted in thousands of new sellers joining the platform.
Amazon continued to optimize internal systems, acquiring Kiva Systems in 2012 (now Amazon Robotics), which automated many warehouse operations. And in 2016, Amazon leased 20 Boeing 767 jets to create Amazon Air marking their first foray into air cargo services. These moves have increasingly positioned them as a competitor to FedEx and UPS.
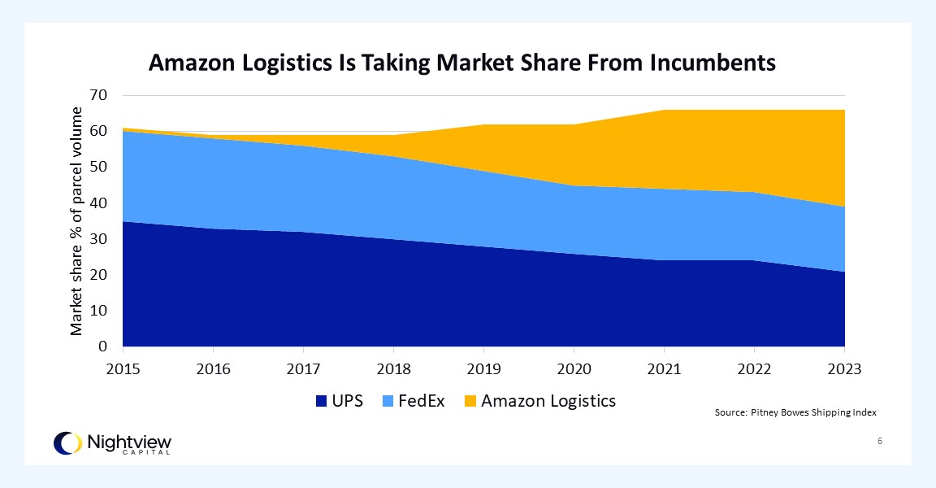
These various endeavors ultimately led to the launch of Amazon Logistics. In 2019, Amazon announced its intention to open this logistics network to other businesses, offering end-to-end solutions. Outside businesses can now access Amazon’s economies of scale, including services like: Amazon Logistics (AMZL), Amazon Warehousing and Distribution (AWD), Buy with Prime, and Multi-Channel Fulfillment (MCF). These initiatives not only increase revenue for Amazon, but can also further increase the competitive moat by increasing volumes—which in turn allows increased infrastructure spend and reach.
We will highlight one of these businesses, Buy With Prime, below:
Buy with Prime
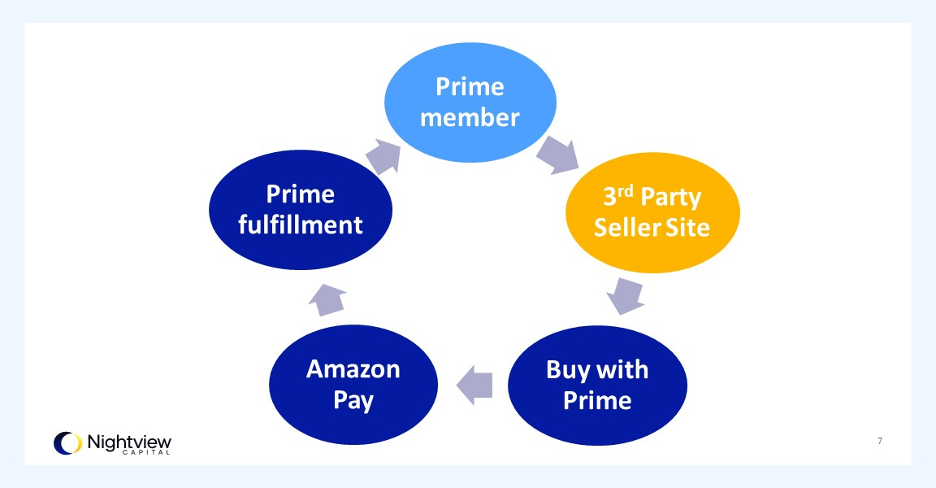
Expanded to all eligible U.S. merchants in 2023, Amazon’s “Buy with Prime” initiative allows third-party merchants to integrate Amazon checkout into their own websites. In addition, “Buy with Prime” orders are also fulfilled by Amazon. This move effectively allows independent online shop owners to retain their brand identity, while tapping into Amazon’s massive logistics infrastructure. It also creates a flywheel for Amazon to attract new Prime customers by effectively outsourcing its marketing to independent sellers who host the “Buy with Prime” button on their websites.
The plumbing is fairly simple: the payment processing runs through Amazon, and the products must be housed in Amazon fulfillment centers. For customers, instead of paying for slow shipping through an unknown shipping company, Buy with Prime provides a familiar, trusted experience bolstered by Prime shipping and return guarantees.
Early indications point to a hit with merchants. Buy with Prime is increasing shopper conversion rates by 25%, and 87% of Buy with Prime orders are from new customers on third-party sites.[5] Shopify initially posed a hurdle to Buy with Prime integration, but Amazon and the Toronto-based tech company have since reached an agreement to play nice. This opens Amazon’s fulfillment network to even more merchants and is a signpost of the infrastructure moat the company built.
Faster and Cheaper Shipping
As part of the overall logistics expansion, Amazon has been obsessively driving down the rate of click-to-door speed, giving the company an advantage over its competitors. As Andy Jassy remarked in the Q1 2024 earnings call, “across our top-60 largest U.S. metro areas, nearly 60% of Prime members’ orders arrived the same or next day. And globally, in cities like Toronto, London, and Tokyo, about three out of four items were delivered the same or next day.”
What is even more impressive is that Jassy remarked that faster speeds don’tmean higher costs. Same day facilities are the least expensive facilities in the network. And this is great news for investors as ‘same day’ facilities are still a fraction of where they will be.

The push into speedy last-mile delivery has also increased the reliability of Amazon’s delivery partners, reducing delivery times from two days to one, or same-day for Prime members. Increased delivery velocity unlocks higher wallet share for Amazon customers shopping on Amazon. Customers increasingly choose to buy groceries and other items they might have otherwise made a trip to a store for.
As Andy Jassy said in his 2023 letter to shareholders: “Faster delivery times have another important effect. As we get items to customers [the same or next day], customers choose Amazon to fulfill their shopping needs more frequently, and we can see the results in various areas, including how fast our essentials business is growing”
Competition
Over the past couple of years there has been concern about upstart rivals Shein and Temu eroding Amazon retail dominance. These platforms have used aggressive sales tactics, in a short period of time, to increase revenue dramatically.
While we are keeping a keen eye on the impressive progress of these Chinese upstarts, we are not overly concerned at the moment at their ability to meaningfully affect Amazon’s core business. We have seen competitors attempt to bootstrap their way into Amazon’s territory in the past, notably Jet.com, which was eventually bought out by Walmart.
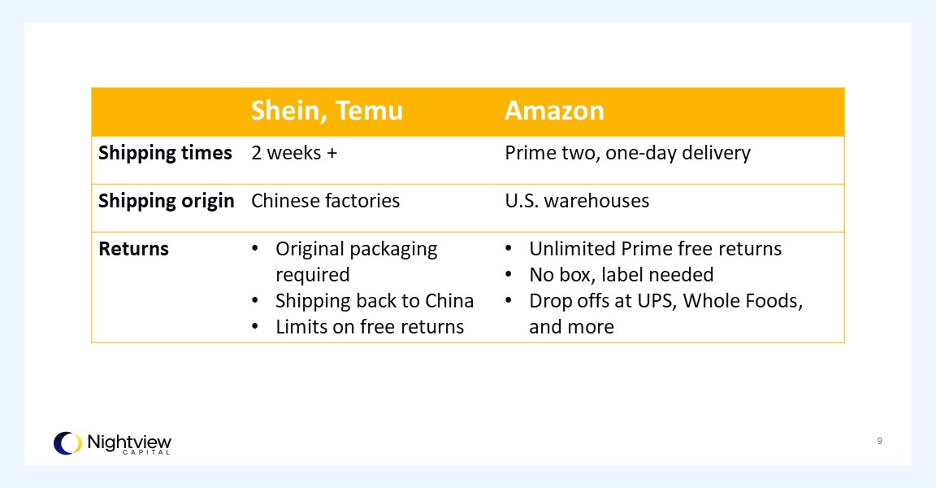
Amazon has adapted and recently announced they will offer direct from China shipping to the United States sometime fall of 2024. We believe this will be a material hit to companies Shein and Temu, but most importantly, we believe the power of Amazon’s prime network to deliver goods quickly will prevail.
North American & International Retail
The transition from brick-and-mortar retail to e-commerce is one of the oldest business transformations created by the internet. Since his days at D. E. Shaw the big idea Jeff Bezos had was to create the “everything store”.
The concept was straightforward: the unlimited shelf space of the internet would provide an opportunity for a business to be an intermediary for all goods. The initial toehold was books, but the goal was always to sell everything.
North American Retail
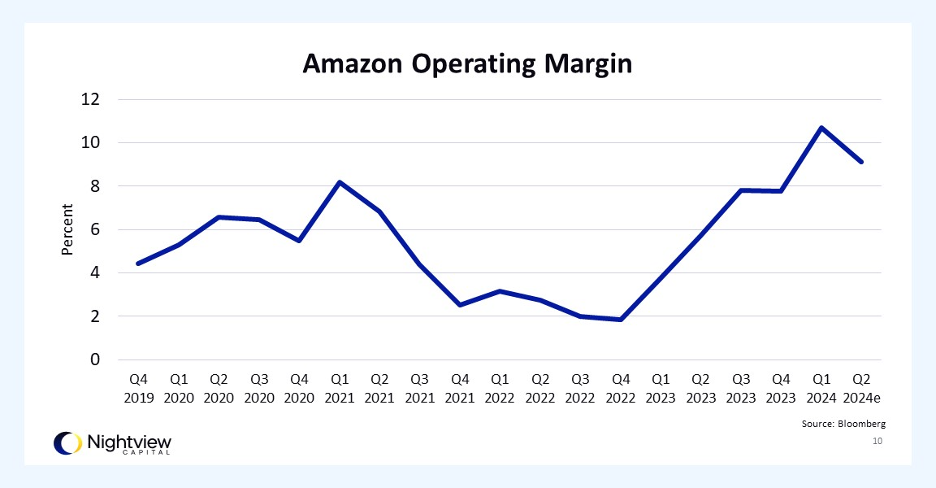
We still believe that there is room for growth and further transition to e-commerce over the coming decade. During the pandemic Amazon logistics overexpanded – in part because they were providing a mission critical service to the United States. Costs accelerated and earnings (I.e. EBIT margin) dropped from 4.1% in 2019 to (0.9%) in 2022.
We believe a false conclusion was inferred by many market participants that this meant the retail platform was structurally unprofitable. Market consensus seemed to be that the retail business was effectively worthless and only valuable as a platform to launch new products.
There was a massive investment cycle with capital expenditures spending reaching 12.6% and 13.4% of total North American revenue in 2020 and 2021 respectively. We are now a few quarters into a retooling of the logistics business for a more normalized environment. Operating margins have steadily climbed since the doldrums of the pandemic overexpansion, now exceeding 2019 levels.
The trend that we calculate is that, absent the disruptions caused by COVID and its resulting effects, the normalized trend line is that operating margin in North American retail is seeing significant operating leverage. We predict earnings margin to continue to increase throughout the decade, stabilizing in low double digits. We believe this will add not only to company operating profits, but cash flow from operations as well.
With U.S. e-commerce representing around 15.4%[DC1] of retail sales there is still years of transition from brick and mortar to e-commerce[6]. As we highlighted earlier, Amazon has brought click to door to somewhere around ~1.4 days – with a large and increasing number of products available same day. This opens a large category of retail wallet spend centered around same day purchases.
While we don’t believe that e-commerce will ever be anything close to 100% of total sales, we feel confident it will be significantly higher in the next decade. Thus, allowing the transition to e-commerce, already in its third decade, solid growth throughout the decade.
International Retail
We believe we are also seeing the result of many years of investment turning into operating leverage in the international retail business. This segment reached an earnings (i.e. EBIT margin) low of (6.6%) in 2022. Similar to the North American segment, this was the result of an overexpansion during COVID that appears to have been rectified.
We saw a year-over-year improvement of 7.1% in operating margin in Q1 2024 with earnings/EBIT margin reaching 2.8%. The trend in operating margin is now firmly positive and our projections have this following a similar, if reduced, margin path to the North American retail business.
This is still relatively early days and there are unique challenges to this business line not present in the North American business. This is a longer-term play that, in our opinion, will continue to grow revenue in the low teensfor the foreseeable future and has the potential to unlock profits.
AWS
We believe the AI transition will be net accretive to all three hyperscale cloud providers (AWS, Azure, Google Cloud)[7].
Similar to the retail business, we saw a deceleration in AWS after COVID. But we believe that mid-to-high-teens revenue growth is the most likely scenario going forward. This is on a formidable base and with EBIT margins expanding nicely.
This is an exciting time in the hyperscaler space. We are only beginning to crack the possibilities of what generative AI can accomplish in enterprise. While the road will undoubtedly be lumpy and with seeming fits and starts, we do believe that the AI transition will be the most radical transition since the internet in the 1990s.
One of the great aspects of the cloud business is the “stickiness” of customers once they have moved from on-premise to the cloud. We believe Amazon is poised to reap the rewards of a rising tide of data consumption.
There is still years of potential runway ahead with global IT spend still only around 10% in the public cloud today, according to Amazon. Again, we will probably never get to 100%, similar to e-commerce, but we believe the penetration percentage will be multiples higher in the future.
Valuation
While we won’t speculate on the near-term price action of any security—nor do we make specific projections about the future—our internally-calculated current discounted cash flow (DCF) model (as of 6/30/2024) suggests a fair market value of around ~ $290 / share for AMZN.
This calculation is based on a weighted average cost of capital (WACC) of 10.75% (which we believe could come down), 2030 free cash flow to the firm (FCFF) of ~ $250 billion, and an Enterprise Value / EBITDA (Earnings Before Interest, Taxes, Depreciation, and Amortization) exit multiple of 13—roughly in line with historical averages.
In addition, we model a return to less working capital investment, a slight normalization of capital expenditures (CAPEX) and increased depreciation and amortization (D&A) over the decade.
Of course, these calculations can (and will) change as market and company conditions shift.
If AMZN exceeds our expectations and outperforms our estimates, our model could suggest a considerably higher current fair market value of $390 / share. The path to this outcome would center around a sustained re-acceleration of AWS revenues over the next several quarters into the high teens—and further long-term expansion of operating margins. This would also reflect a longer-term trend in less CAPEX growth, a normalization of working capital investment, and a reduction of WACC. Again, this is a dynamic environment, and we are always updating our models based on incoming information.
Overall, we see potential for additional value through increased margin expansion, reduction in weighted average cost of capital (WACC,) minor deflationary elements in CAPEX, above trend international e-commerce expansion, and significant upside to North American retail margins in the near to intermediate term.
We feel, while downside risk is always possible, the current moment offers a highly attractive mix of several ways to win and opportunities for expectation beats throughout the business.
See below for a brief overview of each portfolio company in The Nightview Fund (NITE).
Positions below are listed alphabetically and reflect NITE holdings as of July 01, 2024. The most recent holdings information and weighting can be found on the NITE website.
Current and future holdings are subject to risk. Fund holdings are subject to change without notice and are not buy/sell recommendations.
Weightings in NITE as of 07/01/2024
Airbnb (ABNB) — 8.02%
Overview: As a leader in the home-sharing and travel experiences sector, we believe Airbnb will maintain its upward trajectory, bolstered by strong financial performance and strategic foresight. The COVID-19 pandemic forced Airbnb to streamline operations, resulting in significant operating leverage and robust cash flow generation. Airbnb’s business model aligns with the growing consumer preference for experiences over material goods, positioning it for continued growth. In our view, the company has demonstrated resilience and adaptability, leveraging these trends to enhance its market position.
Why we own it: We believe the company is well-positioned to capitalize on secular trends favoring long-term stays and consumer prioritization of experiences, driving sustained growth and earnings outperformance. We also believe Airbnb management demonstrates exceptional leadership and a strong focus on product development.
Amazon (AMZN) – 13.03%
Why we own it: Please refer to our full thesis, published in our Q2 2024 Investor Letter.
Apple (AAPL) — 4.85%
Why we own it: We believe a computing platform shift will help drive an accelerated upgrade cycle for the iPhone, MacBooks, and the rest of Apple’s ecosystem. We believe Apple’s ecosystem penetration in the U.S. via its iPhone business provides a structural advantage in attracting next generation applications.
Overview: Apple’s shift to designing its own CPUs with its M series chips for its Macs and iPads moves more capabilities in-house and allows the company to design its OS and processors in tandem. The company has also been packing specialized neural computing capability into these chips. The latest M4 chips boast 38 trillion operations per second, a key measure of the AI capability of a processor. We believe on-device AI will be integral to the future adoption of consumer technology, and Apple is well-positioned to deliver these applications to its millions of customers. Finally, we believe Apple is best positioned to capture another new computing platform in spatial computing. Its first foray into the market with the Vision Pro is effectively a dev kit instructive of what might be coming. We think over time, Apple will go down market in spatial computing, releasing lower-cost devices more accessible to the average consumer.
BlackRock (BLK) — 3.12%
Why we own it: BlackRock exemplifies growth through scale, managing $10.5 trillion in assets under management. With a vast user base and strong operating leverage, we believe BlackRock is well-positioned to capitalize on both near-term market opportunities and long-term digital economy trends.
Overview: We believe that asset re-allocation from money market funds to equities, as markets continue to post strong returns and interest rates fall, provides a growth opportunity in the near term. BlackRock’s ETFs are outstanding low-cost vehicles for many investors to get broad access to a range of markets and strategies. BlackRock’s diversity of products also gives the company some unique advantages in the changing asset management landscape. Well positioned for a push for more products under one roof. While the fee environment continues to provide headwinds, dragging down revenue below growth levels, the company is exhibiting solid cost discipline and operating margins are now 42.2%, which is up solidly over last year. We believe this trend towards increased profitability is likely to continue. Historically, share price and AUM have grown in correlation. Fee compression has been one of the factors potentially causing this dislocation, but operating leverage has the potential to increase margins going forward, and the most likely path is convergence once again.
DraftKings (DKNG) — 4.11%
Why we own it: We believe DraftKings (DKNG) is poised to benefit from the growing online sports betting and iGaming industries. With the remaining 50% of the market ultimately expected to allow regulated online betting, we believe DraftKings’ top line and free cash flow are set to expand significantly.
Overview: DraftKings has been a significant player in the online betting market since it started acquiring customers through daily fantasy sports products in 2012. The legal landscape for online sports betting and casino gaming has evolved significantly, with a landmark 2018 Supreme Court case paving the way for legalization in several U.S. jurisdictions. DraftKings, along with FanDuel, holds a dominant market position, each commanding 35-40% of the market share. Even in more mature states, growth metrics such as user base and betting handle continue to increase at impressive rates. DraftKings is a robust digital platform with diverse product offerings that deliver value to customers and enhance margins. While marketing and promotional expenses are inherent to the business model, these costs are expected to decrease as a percentage of revenue over time. Although tax rates on digital betting profits may rise, the current phase of user acquisition and product normalization suggests significant long-term growth potential.
Goldman Sachs (GS) — 4.67%
Why we own it: Goldman Sachs is executing well on its strategic initiatives with solid revenue growth across a variety of income streams while maintaining discipline on both non-comp and comp expenses. In our view, the company stands to benefit from increased M&A activity going forward and has premier businesses and prestige in its various segments.
Overview: In Q1, Goldman’s investment banking and trading arms performed quite well, helping drive top line growth at 16% in the quarter. We are also starting to see some an increase in IPOs dealflow in Q1, and as we have heard remarked by others in the space this quarter on earnings calls, increased deal flow. Companies need access to capital markets and can only delay their decisions for so long. To us, this is a strong sign that could provide solid revenue growth going forward. We have seen a dramatic increase in alts exposure in private client portfolios and Goldman, through both their prestige and pedigree, are well positioned to allocate to proprietary and outside portfolios.
Google (GOOGL) — 3.50%
Why we own it: Google stands as a unique platform business within the global technology landscape, remaining an attractive risk-reward scenario. Despite concerns about AI’s impact on search, we believe Google’s dominance and extensive data provide a strong moat, ensuring continued market leadership.
Overview: Google’s position as a platform business is unparalleled. While there are concerns about the potential disruption from AI, particularly in search, we believe these are currently overblown. The initial negative reaction from investors to ChatGPT’s release has been tempered by Google’s development of its own generative AI, leveraging its vast search data and experience. Google’s decades of indexing the web and training data from trillions of searches fortify its position in AI. Additionally, Google Cloud’s AI offerings are top-tier, supporting diverse hardware preferences and reinforcing its standing in hyperscale cloud computing—a long-term secular trend we are confident in. Google’s subscription services, including YouTube TV, YouTube Premium, and Google One, represent significant growth areas. We believe users will continue to favor Google Search for commercially motivated queries, sustaining its robust ad model and reinforcing its market leadership.
Hyatt (H) — 4.37%
Why we own it: Hyatt is a key player in our hospitality theme, offering a durable and a top-of-value chain service model. Its strong management and global room growth position it well for long-term success and capital protection.
Overview: Hyatt exemplifies our commitment to the hospitality sector, a durable model that spans gaming, lodging, homestays, and conventions. The company’s well-managed operations and global room growth exceed GDP rates, highlighting its strong market presence. Hyatt’s significant leverage in the convention business, a more cyclical segment, positions it for potential outperformance during favorable economic conditions. Although Hyatt has been slower than peers in transitioning to an asset-light business model, its asset disposition strategy is progressing. This shift is expected to enhance free cash flow over time, providing a catalyst for improved financial performance. Our investment in Hyatt reflects our confidence in the hospitality sector’s resilience and Hyatt’s ability to navigate and capitalize on market opportunities. The company’s strategic initiatives and robust growth trajectory reinforce its role as a valuable component of our portfolio.
Las Vegas Sands (LVS) — 2.81%
Why we own it: We believe the overall Asian gaming market will continue to grow throughout the decade. In our view, Las Vegas Sands, as a pure play on Macao and Singapore, is well positioned to capitalize on this trend. Marina Bay Sands in Singapore is a global destination property and has further room for profitability expansion.
Overview: Marina Bay Sands in Singapore remains a world-class asset and we believe further easing of visa policies between China and Singapore will provide a tailwind. With the highest percentage of gambling participation globally, Singapore’s market is crucial for Las Vegas Sands. The Macao gaming market has continued to re-normalize after opening in early 2023. The gross gaming revenue run rate has increased YoY from $17 billion in Q1 2023 to $28 billion in Q1 2024. While LVS has seen a mildly sluggish recovery in Macao, we remain confident in the long-term prospects. We believe the renovated Cotai Arena and Londoner hotel will be premier destinations in this vitally important gaming market.
Meta (META) — 3.47%
Why we own it: Meta harnesses advanced AI expertise across its products, solidifying its leadership in the digital advertising landscape. With over 2 billion monthly active users and a strong founder-led approach, we believe Meta will maintain a significant long-term moat and opportunities for re-expansion.
Overview: Meta leverages its deep AI expertise to enhance its diverse product suite, including Instagram, WhatsApp, and Facebook. The company’s AI Research lab, responsible for developing PyTorch, has positioned Meta at the forefront of AI technology, facilitating the creation of cutting-edge AI models. The company’s platforms offer highly engaged audiences, essential for businesses aiming to promote their products and services effectively. Meta’s dominance in digital advertising is reinforced by its ability to deliver some of the most engaged ad-viewers in the market. Furthermore, Meta exemplifies the value of founder-led companies, which are prevalent across our portfolio.
MGM Resorts (MGM) — 2.76%
Why we own it: MGM Resorts stands as the largest asset-owner on the Las Vegas Strip, offering significant exposure to the thriving Las Vegas market. This position is fundamentally a bullish bet on Las Vegas and continued strength and diversification of the market.
Overview: We’re encouraged by Las Vegas’ embrace of new technology like the Sphere, transport tunnels, and the high-speed rail project that will soon connect the destination city to America’s second-largest metropolitan area in Los Angeles. MGM is partnering with Marriott to integrate its booking portal, which we believe will generate significant business with the 100 million+ Bonvoy members. MGM’s strategic positioning and extensive assets underscore its leadership in the gaming and hospitality industry.
Morgan Stanley (MS) — 4.76%
Why we own it: With Morgan Stanley trading at what we believe is a compelling valuation, we view increased upside as various cyclical operating segments begin to accelerate.
Overview: Morgan Stanley continues to execute with likely revenue growth for FY 24 in the high teens. We believe it appears increasingly likely that we are at the early stages of a renewed M&A cycle. With over $7 trillion in client assets across wealth and investment management, Morgan Stanley maintains a strong asset management business relative to other investment banks. This provides a more stable and predictive revenue stream compared to the generally cyclical nature of investment banking and trading. We also believe investment banking, capital markets, and trading revenues are set to rise this fiscal year, which should generate solid operating leverage going forward.
Netflix (NFLX) — 4.69%
Why we own it: Netflix (NFLX) remains a dominant force in the streaming industry, demonstrating strong cash flow and strategic content investments. The company’s evolving approach, including the potential for live event licensing and ad integration, offers significant growth opportunities.
Overview: Netflix has solidified its position as a leader in the streaming wars, outlasting a wave of new competitors and securing its business model. Recent developments, such as Time Warner licensing Max content to Netflix, underscore its industry clout. The company is generating substantial free cash flow, enabling continuous investment in original content. Management’s interest in securing creative live event licenses signals a potential new revenue stream. Additionally, Netflix is in the nascent stages of its ad-supported model, which could further enhance profitability through improved vertical integration and premium ad monetization. With nearly 270 million subscribers, Netflix has seen remarkable growth over the last decade. We believe the company is well-positioned to expand its market share in the premium video streaming sector, leveraging its vast subscriber base and innovative strategies to stay ahead of the competition.
Qualcomm (QCOM) — 8.55%
Why we own it: We believe we’re in a structural upgrade cycle in hardware generally—and handsets specifically. In our view, Qualcomm will be a primary beneficiary of this cycle. Additionally, we believe the transportation segment will continue in a trend towards greater connectivity, requiring increased supply from Qualcomm.
Overview: Chips made for the mobile phone market is Qualcomm’s largest business line. In mobile devices (including IoT), power-efficient chips are paramount because the battery size is small—and power is limited. Qualcomm chips are known for their power efficiency, so much so that Apple has yet to remove Qualcomm from its radio frequency supply chain. Additionally, in AI computing power, efficiency is crucial because tasks are so compute hungry. Qualcomm is now also the CPU, GPU, and NPU backbone for all-new Windows AI PCs. Initial reports are positive on these new PCs, potentially driving an upgrade cycle for PCs with Qualcomm inside, taking share from Intel and others. Additionally, Qualcomm’s automotive revenue was $4 billion in 2023. Management expects the business unit to grow to $9 billion by 2031. We believe cars and transport in general will increasingly become electric—and digital. As this transition occurs, we believe it will open opportunities for companies like Qualcomm to capitalize on the need for performant, power-efficient chips for communications and compute tasks.
Schwab (SCHW) — 4.59%
Why we own it: A core thesis of ours is in the democratization of investing, and we believe that Schwab could be well-positioned as a primary beneficiary of this global secular growth trend, especially following its acquisition of TD Ameritrade.
Overview: Schwab, the largest public brokerage by number of active accounts, successfully integrated TD Ameritrade, with customer migrations exceeding expectations with minimal churn. Although caught up in the 2023 Silicon Valley bank runs, we believe Schwab is recovering as headwinds ease. The introduction of forex trading on its platform marks an expansion of its services, enhancing its competitive edge and client offerings. Q1 saw an uptick in daily average trades of 15%, and we believe Schwab is well-positioned to capitalize on further investment cycles.
Taiwan Semiconductor (TSM) — 6.55%
Why we own it: Taiwan Semiconductor (TSM) fabricates more than 50% of the world’s chips, positioning it as perhaps the most crucial player in the global semiconductor industry. With significant capital expenditures and a specialized workforce, TSM has established a strong competitive moat and pricing power within the supply chain.
Overview: Taiwan Semiconductor is a decades-old titan at the center of the chip boom. Its business model focuses on fabricating chips for fabless companies that design cutting-edge technology, leveraging TSM’s expertise in semiconductor production. The company dominates the market, manufacturing more than 95% of the world’s advanced process chips. With substantial investments in research and development, TSM is advancing towards the commercialization of 3nm process chips. The AI chip boom presents significant growth opportunities, with data center build-outs projected to be worth hundreds of billions of dollars. Despite geopolitical concerns, such as potential threats from China, we think the risk / reward balance remains attractive.
Tesla (TSLA) — 13.24%
Why we own it: We have long believed Tesla retains strong first-mover advantages in transportation electrification, real-world artificial intelligence, and battery energy storage deployments. We believe there is ample runway ahead for Tesla’s growth, and it could become one of the most valuable companies in the world over time.
Overview: In our Q1 quarterly letter, we addressed some of the short-term concerns about recent volume growth deceleration. Our conclusion is that, despite near-term headwinds, we believe Tesla is well-positioned for growth over the next several years. On August 8th, Tesla is set to reveal its Robotaxi platform – inclusive of ride-hailing functionality. Additionally, Shanghai Robotaxi appears to be underway according to recent media reports, which represents another promising milestone for Tesla’s Robotaxi platform. On a macro level, we also believe lower interest rates and a reversion to the mean on consumer sentiment could help boost electric vehicle demand in the coming quarters. We’re also increasingly confident in the sustained growth of Tesla’s commercial energy storage business, with a recent uptick in deployments, per the Q2 2024 P&D report. Our view is that Tesla has a deep enough engineering lead to potentially dominate the commercial energy market.
Wynn Resorts (WYNN) — 2.90%
Why we own it: Wynn owns premier assets, and the global gaming story will be a major growth trend over the next decade in our opinion. The current valuation has room to grow and is below historical comps. We are excited about potential expansion options in new markets going forward.
Overview: Wynn Resorts boasts best-in-class assets in Las Vegas and Macau, providing a balanced revenue diversification model across gaming geographies. Again, the Macau recovery has been slower than expected, but Wynn has held or grown market share in Macau as visitation has recovered in the jurisdiction. Wynn’s long-term growth initiatives and existing premium assets position it well for future growth in the global gaming industry, in our view. Its UAE project is coming along, which is a JV (RAK Hospitality & Al Marjan Island) with Wynn retaining 40% equity, and still a couple years out from opening. Prospects on the horizon: a New York project is still a possibility, and Thailand increasingly is becoming a target for development, in our view.
Disclosures
Investors should consider the investment objectives, risks, and charges and expenses of the Fund(s) before investing. The prospectus contains this and other information about the Fund and should be read carefully before investing. The prospectus may be obtained at (866) 666-7156.
The Fund is distributed by Northern Lights Distributors, LLC, Member FINRA/SIPC.
Past performance is no guarantee of future results.
Investing involves risk, including loss of principal. There is no guarantee the fund will achieve its investment objective. As an actively-managed ETF, the fund is subject to management risk, Equity Securities Risk, Market Risk, Mid-Cap Company Risk, New Fund Risk, Operational Risk, Sector Risk, Small-Cap Company Risk, Smaller Fund Risk, Trading Risk, Value Investing Risk.
Non-Diversification Risk. Investment in the securities of a limited number of issuers or sectors exposes the Fund to greater market risk and potentially greater market losses than if its investments were diversified in securities and sectors. Issuer-Specific Risk -changes in the financial condition or market perception of an issuer may have a negative impact on the value of the Fund, and this risk may be exacerbated but by the relatively small number of positions that the Fund holds.
Secondary Market Liquidity Risk. Shares of the Fund may trade at prices other than NAV. As with all exchange traded funds (“ETFs”), Fund shares may be bought and sold in the secondary market at market prices. The trading prices of the Fund’s shares in the secondary market generally differ from the Fund’s daily NAV and there may be times when the market price of the shares is more than the NAV (premium) or less than the NAV (discount). This risk is heightened in times of market volatility or periods of steep market declines. Additionally, in stressed market conditions, the market for the Fund’s shares may become less liquid in response to deteriorating liquidity in the markets for the Fund’s underlying portfolio holdings. When an ETF is first launched, it is unlikely to have immediate secondary market liquidity. There is likely to be a lead market maker making markets of significant size, but it is unlikely there will be many market participants on day one of trading. This lack of secondary market liquidity may make it difficult for investors to transact in Fund shares in the market, and the market price consequently may deviate from the Fund’s NAV. As the Fund begins to trade and as client interest increases, more and more market participants buy or sell shares of the Fund and secondary market liquidity will grow. While all ETFs can be held for prolonged periods or intraday, some ETFs experience more secondary market trading than others.
New Fund Risk. The Fund is newly formed, which may result in additional risk. There can be no assurance that the Fund will grow to an economically viable size, in which case the Fund may cease operations. The Fund may be liquidated by the Board of Trustees (the “Board”) without a shareholder vote. In such an event, investors may be required to liquidate or transfer their investments at an inopportune time.
Early Close/Trading Halt Risk. Growth Investing Risk. To the extent that the Fund invests in growth-oriented securities, the Adviser’s perception of the underlying companies’ growth potentials may be wrong, or the securities purchased may not perform as expected.
Large or Mega-Cap Company Risk. The Fund will invest a relatively large percentage of its assets in the securities of large-capitalization and/or mega-capitalization companies. As a result, the Fund’s performance may be adversely affected if securities of large capitalization companies and/or mega-capitalization companies underperform securities of smaller-capitalization companies or the market as a whole. The securities of large-capitalization companies may be relatively mature compared to smaller companies and therefore subject to slower growth during times of economic expansion. Limited Authorized Participants, Market Makers and Liquidity Providers Risk. Because the Fund is an ETF, only a limited number of institutional investors (known as “Authorized Participants”) are authorized to purchase and redeem shares directly from the Fund. In addition, there may be a limited number of market makers and/or liquidity providers in the marketplace. To the extent either of the following events occurs, the risk of which is higher during periods of market stress, the Fund’s shares may trade at a material discount to net asset value (“NAV”) and possibly face delisting: (i) Authorized Participants exit the business or otherwise become unable to process creation and/or redemption orders and no other Authorized Participants step forward to perform these services, or (ii) market makers and/or liquidity providers exit the business or significantly reduce their business activities and no other entities step forward to perform their functions.
The opinions expressed herein are those of Nightview Capital and are subject to change without notice. The opinions referenced are as of the date of publication, may be modified due to changes in the market or economic conditions, and may not necessarily come to pass. Forward-looking statements cannot be guaranteed. This is not a recommendation to buy, sell, or hold any particular security. There is no assurance that any securities discussed herein will remain in an account’s portfolio at the time you receive this report or that securities sold have not been repurchased. It should not be assumed that any of the securities transactions, holdings or sectors discussed were or will be profitable, or that the investment recommendations or decisions Nightview Capital makes in the future will be profitable or equal the performance of the securities discussed herein. Nightview Capital reserves the right to modify its current investment strategies and techniques based on changing market dynamics or client needs.
20240717-3701717
[1] https://www.pewresearch.org/journalism/fact-sheet/newspapers/
[2] https://www.wsj.com/business/media/amazon-has-upended-the-streaming-ad-market-and-netflix-is-paying-the-price-260c1b26
[3] https://www.nexttv.com/news/85-of-amazon-prime-video-subscribers-are-on-the-ad-supported-tier
[4] AMZN 10k for fiscal year ended December 31, 2016.
[5] https://buywithprime.amazon.com/customer-stories/case-study-sherpani
[6] https://fred.stlouisfed.org/series/ECOMPCTSA
[7] Nightview Capital: How AI Could Fuel Hyperscaler Profits For a Decade (or More)
[DC1]https://fred.stlouisfed.org/series/ECOMPCTSA